注意
跳到末尾以下载完整示例代码。
割点
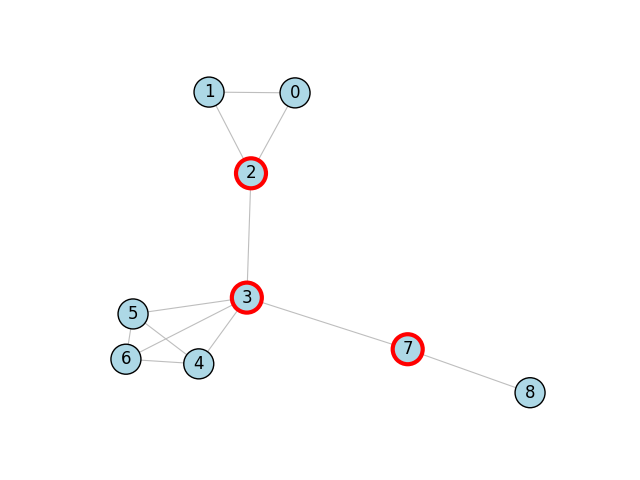
本示例展示了如何使用 igraph.GraphBase.articulation_points() 计算和可视化图中的 割点。有关桥的示例,请参阅 桥。
import igraph as ig
import matplotlib.pyplot as plt
首先,我们构造一个图。本示例展示了图公式的用法
g = ig.Graph.Formula(
    "0-1-2-0, 3:4:5:6 - 3:4:5:6, 2-3-7-8",
)
现在我们准备好查找作为顶点序列的割点
最后,我们可以绘制该图
fig, ax = plt.subplots()
ig.plot(
    g,
    target=ax,
    vertex_size=30,
    vertex_color="lightblue",
    vertex_label=range(g.vcount()),
    vertex_frame_color = ["red" if v in articulation_points else "black" for v in g.vs],
    vertex_frame_width = [3 if v in articulation_points else 1 for v in g.vs],
    edge_width=0.8,
    edge_color='gray'
)
plt.show()
脚本总运行时间: (0 分 0.093 秒)