注意
前往末尾以下载完整示例代码。
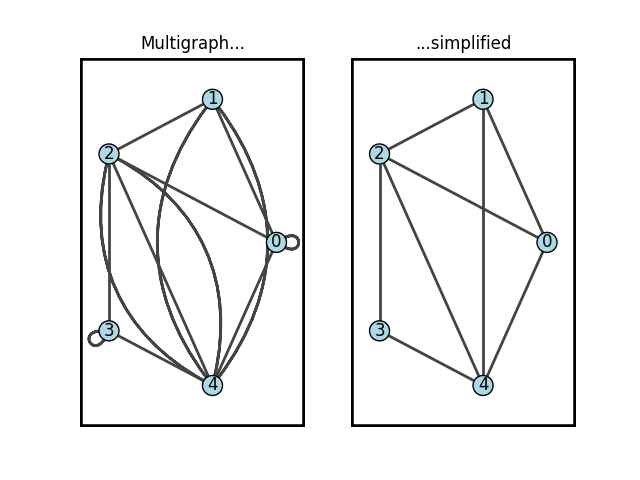
简化
本示例展示了如何使用 igraph.GraphBase.simplify() 移除自环和多重边。
import igraph as ig
import matplotlib.pyplot as plt
我们从一个包含自环和多重边的图开始
要简化图,我们必须记住该函数是原地操作的,即它直接更改运行它的图。因此,我们需要先复制我们的图,然后简化该副本,以保持原始图不变
<igraph.Graph object at 0x7d2bbc025150>
然后我们可以绘制这两个图以查看差异。首先,让我们选择一种一致的视觉风格
visual_style = {
    "vertex_color": "lightblue",
    "vertex_size": 20,
    "vertex_label": [0, 1, 2, 3, 4],
}
最后,让我们在双轴中绘制它们,并在每个图周围添加矩形框
fig, axs = plt.subplots(1, 2, sharex=True, sharey=True)
ig.plot(
    g1,
    layout="circle",
    target=axs[0],
    **visual_style,
)
ig.plot(
    g2,
    layout="circle",
    target=axs[1],
    **visual_style,
)
axs[0].set_title('Multigraph...')
axs[1].set_title('...simplified')
# Draw rectangles around axes
axs[0].add_patch(plt.Rectangle(
    (0, 0), 1, 1, fc='none', ec='k', lw=4, transform=axs[0].transAxes,
    ))
axs[1].add_patch(plt.Rectangle(
    (0, 0), 1, 1, fc='none', ec='k', lw=4, transform=axs[1].transAxes,
    ))
plt.show()
脚本总运行时间: (0分钟 0.105秒)