注意
跳转到末尾 以下载完整示例代码。
最大流
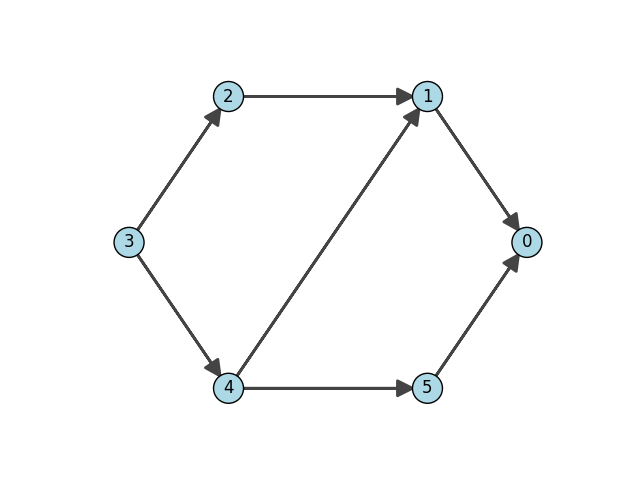
本示例展示了如何使用 igraph.Graph.maxflow() 在有向图上构建具有边容量的最大流。
import igraph as ig
import matplotlib.pyplot as plt
首先,我们生成一个图并为每条边分配一个“容量”
要查找最大流,我们可以简单地运行
flow = g.maxflow(3, 0, capacity=g.es["capacity"])

print("Max flow:", flow.value)
print("Edge assignments:", flow.flow)

# Output:
# Max flow: 6.0
# Edge assignments [1.0, 5.0, 1.0, 2.0, 3.0, 3.0, 3.0]
Max flow: 6.0
Edge assignments: [1.0, 5.0, 1.0, 2.0, 3.0, 3.0, 3.0]
最后,我们可以绘制有向图来查看情况
脚本总运行时间: (0 分 0.063 秒)