注意
跳转到底部以下载完整的示例代码。
Delaunay 三角剖分
本示例演示了如何计算输入图的Delaunay 三角剖分。我们首先使用随机的 numpy 数组在2D网格上生成一组点,并创建一个具有这些顶点坐标但没有边的图。
import numpy as np
from scipy.spatial import Delaunay
import igraph as ig
import matplotlib.pyplot as plt
我们首先在2D单位立方体中生成一个随机图,并固定随机种子以确保可重现性。
np.random.seed(0)
x, y = np.random.rand(2, 30)
g = ig.Graph(30)
g.vs['x'] = x
g.vs['y'] = y
由于我们已经设置了 x 和 y 顶点属性,我们可以使用 igraph.Graph.layout_auto() 将它们封装成一个 igraph.Layout 对象。
layout = g.layout_auto()
现在我们可以使用 scipy 的 scipy.spatial.Delaunay 类来计算 Delaunay 三角剖分
给定三角剖分,我们可以将边添加到原始图中
for tri in delaunay.simplices:
    g.add_edges([
        (tri[0], tri[1]),
        (tri[1], tri[2]),
        (tri[0], tri[2]),
    ])
由于相邻三角形共享一条边/侧,图现在包含了一些重复的边。简化图以去除这些多重边,确保每条边只保留一次是很有用的。
g.simplify()
<igraph.Graph object at 0x7d2bbe80c450>
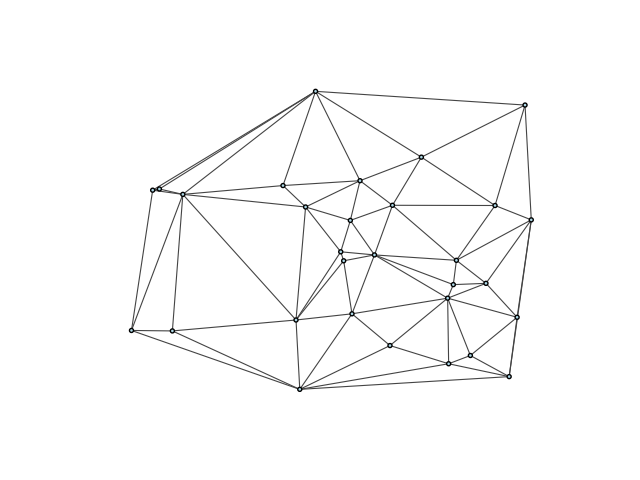
最后,绘制图可以很好地展示三角剖分的样子
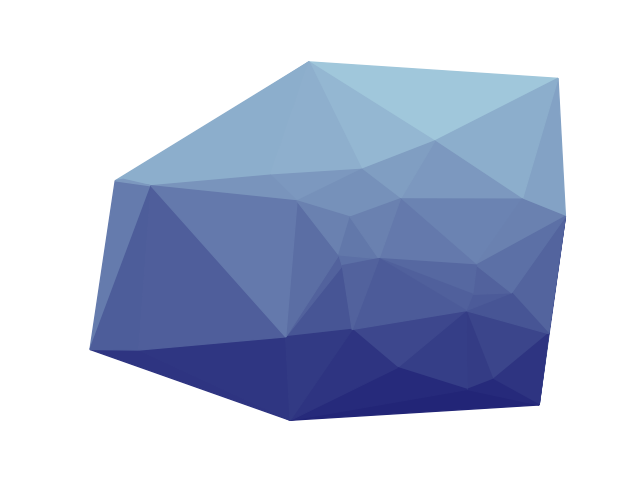
备选绘图样式
我们可以使用 matplotlib 来绘制三角形的面而不是边。首先,我们为三角形面创建颜色渐变
palette = ig.GradientPalette("midnightblue", "lightblue", 100)
然后我们可以使用 matplotlib.patches.Polygon 绘制三角形,并使用 igraph.plot() 绘制图
fig, ax = plt.subplots()
for tri in delaunay.simplices:
    # get the points of the triangle
    tri_points = [delaunay.points[tri[i]] for i in range(3)]

    # calculate the vertical center of the triangle
    center = (tri_points[0][1] + tri_points[1][1] + tri_points[2][1]) / 3

    # draw triangle onto axes
    poly = plt.Polygon(tri_points, color=palette.get(int(center * 100)))
    ax.add_patch(poly)

ig.plot(
    g,
    layout=layout,
    target=ax,
    vertex_size=0,
    edge_width=0.2,
    edge_color="white",
)
ax.set(xlim=(0, 1), ylim=(0, 1))
plt.show()
脚本总运行时间: (0 分 0.529 秒)