注意
转到末尾以下载完整示例代码。
视觉样式
本示例展示了如何更改网络图的视觉样式。
import igraph as ig
import matplotlib.pyplot as plt
import random
要配置绘图的视觉样式,我们可以创建一个字典,其中包含我们想要自定义的各种设置。
visual_style = {
    "edge_width": 0.3,
    "vertex_size": 15,
    "palette": "heat",
    "layout": "fruchterman_reingold"
}
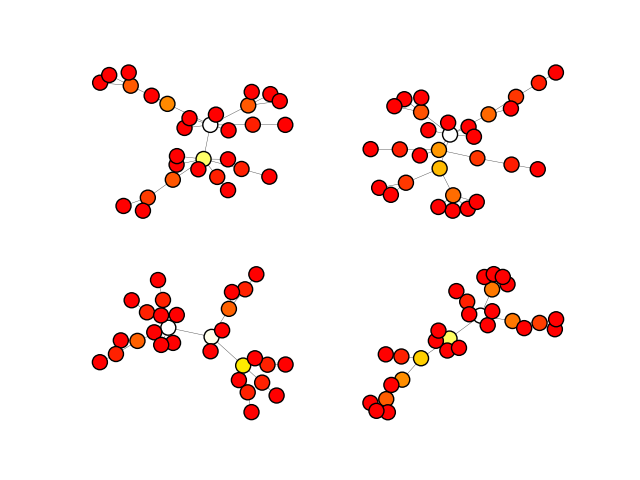
让我们看看实际效果!首先,我们生成四个随机图。
random.seed(1)
gs = [ig.Graph.Barabasi(n=30, m=1) for i in range(4)]
然后,我们为所有节点计算一个介于0-255之间的颜色,例如,仅以介数为例。
最后,我们可以使用相同的视觉样式绘制所有图。
注意
如果您想设置全局默认值,例如始终使用 Matplotlib 绘图后端,或默认使用特定调色板,您可以使用 igraph 的 配置实例 :class:`igraph.configuration.Configuration。一个关于如何使用它的快速示例可以在这里找到:配置实例。
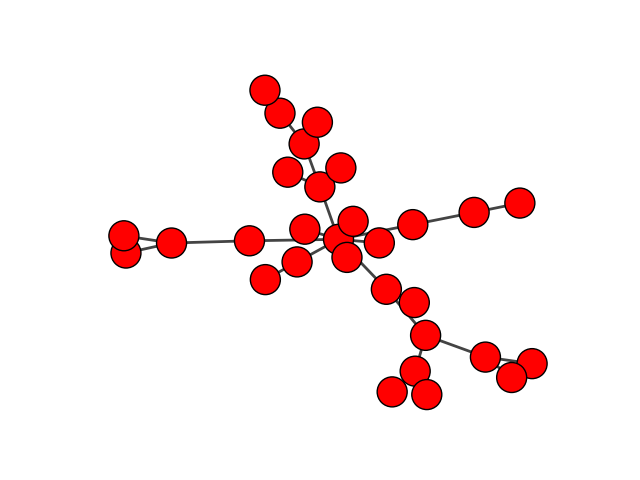
在 Matplotlib 后端中,igraph 创建了一个特殊容器 igraph.drawing.matplotlib.graph.GraphArtist,它是一个 Matplotlib Artist 对象,也是目标 Axes 的第一个子对象。该对象可用于在初始绘图后自定义绘图外观,例如。
g = ig.Graph.Barabasi(n=30, m=1)
fig, ax = plt.subplots()
ig.plot(g, target=ax)
artist = ax.get_children()[0]
# Option 1:
artist.set(vertex_color="blue")
# Option 2:
artist.set_vertex_color("blue")
plt.show()
注意
该 igraph.drawing.matplotlib.graph.GraphArtist.set() 方法可用于同时更改多个属性,通常比多次调用特定的 artist.set_... 方法更高效。
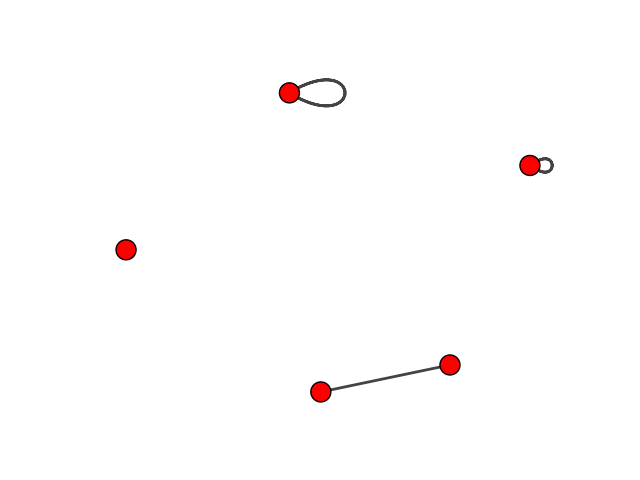
在 Matplotlib 后端中,您还可以指定自环的大小,可以是单个数字或一系列数字,例如。
g = ig.Graph(n=5)
g.add_edge(2, 3)
g.add_edge(0, 0)
g.add_edge(1, 1)
fig, ax = plt.subplots()
ig.plot(
    g,
    target=ax,
    vertex_size=20,
    edge_loop_size=[
        0,  # ignored, the first edge is not a loop
        30,  # loop for vertex 0
        80,  # loop for vertex 1
    ],
)
plt.show()
脚本总运行时间: (0 分 1.145 秒)